A Layman's Guide to OpenShift Monitoring and Logging

High level view...
-
1. This blog will introduce the monitoring and logging capabilities, as well as the configuration knobs avaialble for monitoring OpenShift cluster
-
2. The second article of the series will focus on logging and walk you through the steps to send logs to external syslog server
-
3. The third part of the blog will revisit Monitoring, and walk you through the steps to pull that data by an external application
So you have an OpenShift cluster comprising multiple nodes with a number of Containerized Networking Functions (CNF) running on it. How do you monitor this cluster? How do you gather the logs from all the nodes, and especially How do you collect the logs from specific CNFs and store/process those logs?
Finding these answers by looking at the documentation can prove to be a daunting task for such a simple purpose. This blog, and its subsequent part, will provide a concise and simple guideline to all of those questions.
Data collection from a cluster and its workloads can be placed in two separate categories:
- Monitoringi data in OpenShift lingo refers to performance and telemetry information. This blog will explain how this data is collected and how it can be stored.
- Logs generated by the cluster infrastructure, applications/CNF/workloads running on the cluster, and any audit logs. Log collection will be discussed in detail and examples in the next blog.
Monitoring Data from an OpenShift Cluster
This is the relatively easier one to discuss - because the basic monitoring doesn’t need anything special to be done. The clients and applications needed for collecting monitoring data are already installed and enabled at the time of installation using an operator called Cluster Monitoring Operator `
$ oc get co | grep monitoring
monitoring                                 4.12.34   True        False         False      28d
Collection of infrastructure logs is enabled by default. At the time of installation, a namespace openshift-monitoring is created and the monitoring related pods are spun up in there. One set of those is the node-exporter, run by a daemonset; hence running a copy on each node of the cluster. These node-exporter pods are responsible for collecting data from each individual node and send that to a prometheus pod. The prometheus pod is also spun up by default, and collects the monitoring metrics. The following output shows these pods in a 3-node compact cluster:
$ oc get pods -n openshift-monitoring -o custom-columns='NAME:.metadata.name,NODE:.spec.nodeName'
NAME                                                     NODE
alertmanager-main-0                                      m3
alertmanager-main-1                                      m2
cluster-monitoring-operator-6fd4d445f9-clhj8             m2
kube-state-metrics-866c6d4ccd-7f65d                      m2
node-exporter-2lf8v                                      m3
node-exporter-mvvnj                                      m2
node-exporter-q8ccs                                      m1
openshift-state-metrics-6d4c44d958-ktj64                 m3
prometheus-adapter-59b5d99875-6ngp5                      m2
prometheus-adapter-59b5d99875-rvpnf                      m3
prometheus-k8s-0                                         m3
prometheus-k8s-1                                         m2
prometheus-operator-5ddf4c749c-njxg7                     m3
prometheus-operator-admission-webhook-67468ccc64-v4lpd   m2
prometheus-operator-admission-webhook-67468ccc64-zt4wg   m3
telemeter-client-59b4f4cb94-sgb8k                        m2
thanos-querier-775598784d-5wbg2                          m3
thanos-querier-775598784d-wrl4f                          m2
Other pods that can be seen here are the “Thanos Querier” , “Telemeter Client” and “Alert Manager”, each running in a redundant fashion, and all of them installed by the monitoring operator. Each has a different purpose, for example, the Telemeter Client"is responsible for pushing cluster's metrics to RedHat, hence allowing for monitoring of cluster using redhat console.
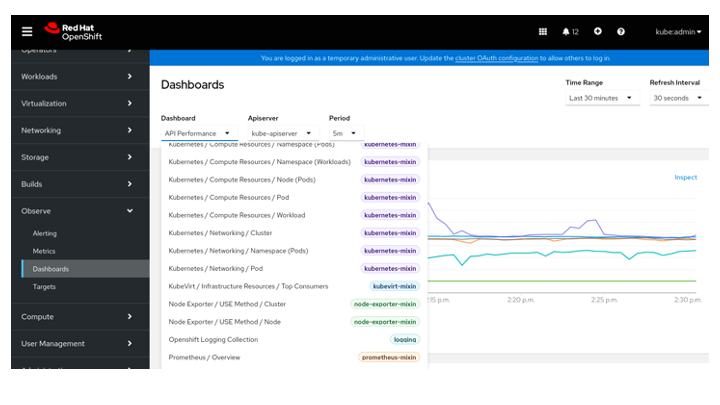
The collected data is available under the observability” menu item in OpenShift console, as shown in the following screenshot:
Storing Monitoring Data
Data collected by prometheus is not stored by default. Storing this data can be enabled, however, a block storage device is required for that.
Amount of data retention can be defined using a retention period, or storage capacit. The config map (in openshift-monitoring namespace) called “cluster-monitoring-config” is used for this purpose. The following example demonstrates how this configmap can be used to define a data retention policy for one-day or 20Gig:
apiVersion: v1
kind: ConfigMap
metadata:
  name: cluster-monitoring-config
  namespace: openshift-monitoring
data:
  config.yaml: |
    prometheusK8s:
      retention: 1d
      ovolumeClaimTemplate:
        spec:
          storageClassName: ocs-storagecluster-ceph-rbd
          resources:
        	requests:
          	storage: 20Gi
Monitoring User Workload Data
By default, monitoring is enabled only for the OpenShift infrastructure. However, monitoring can also be enabled for the pods running workloads or CNFs. This is done by using another configuration knob by adding the following line in the same configmap:
cat << EOF| oc create -f -
apiVersion: v1
kind: ConfigMap
metadata:
  name: cluster-monitoring-config
  namespace: openshift-monitoring
data:
  config.yaml: |
    enableUserWorkload: true
EOF
This creates an additional monitoring namespace called openshift-user-workload-monitoring, and promethues pods for workload monitoring are started under that namesapce as shown here:
oc -n openshift-user-workload-monitoring get pod
NAME                                   READY   STATUS    RESTARTS   AGE
prometheus-operator-5679c779b6-jghd8   2/2     Running   0          7m26s
prometheus-user-workload-0             6/6     Running   0          7m20s
thanos-ruler-user-workload-0           4/4     Running   0          7m19s
If the parameters for the workload monitoring have to be configured or adjusted, that can be achieved by using a config map called user-workload-monitoring-config in the openshift-user-workload-monitoring namespace. This blog will not go into further detail about the various parameters and knobs available to advanced users, but this documentation page can be referenced for exploring those options.
Forwarding Monitoring Data:
Oftentimes in a production environment, an external OSS/BSS system is collecting monitoring data across many devices and clusters. Forwarding of the monitoring data to such an external data collection server can be achieved by defining a remoteWrite URL in the cluster-monitoring-config configmap, as shown here:
cat << EOF| oc create -f -
apiVersion: v1
kind: ConfigMap
metadata:
  name: cluster-monitoring-config
  namespace: openshift-monitoring
data:
  config.yaml: |
    prometheusK8s:
      remoteWrite:
      - url: "URL"
EOF
The URL here is the pointer to the remote monitoring server, Kafka bus etc.
Though this blog doesn’t go into further details on configuring authentication (if needed) and tags (if desired) for metrics being sent to remote location, these and other such details and examples can be found here
That concludes all the basics that one would need to understand OpenShift monitoring concepts and conciguration. For next level information on dealing with OpenShift Logs and Metrics, continue on the subsequent parts of this article